Politics, religion, death and taxes
An investigation into British moral attitudes, and whether religious or political affiliations hold the key to understanding them.


YouGov recently published some fascinating analysis on “perceived majorities”, which examined, for a range of questions, how well Britons could correctly identify the prevailing opinion of the public at large.
One of the most interesting parts of their analysis highlighted topics where people incorrectly believed that their own opinion was shared by a majority of the public, a situation you might describe as being “out of touch”. It found that, on many topics, Conservative and Reform UK voters were more likely to be mistaken in the belief that their own views were shared by the wider populace.
However on one topic – support or opposition to the death penalty – it was supporters of the three more progressive main parties (including myself) who were out of touch, as one of YouGov's charts, reproduced below, demonstrated:
Most of us like to believe we are self-aware – that we have some knowledge of which of our opinions go against the grain, and which are likely to split our peers.
I had been confident that a majority of the public would oppose the death penalty. In fact, 53% of Britons now support it, according to YouGov's latest survey. This fact shocked me. But the chart above suggests that I will not have been alone in my shock – indeed, the fact that reactionary attitudes to the death penalty now prevail seems to be a particular blind spot in progressive voters' awareness.
Digging deeper using the British Election Study
I decided to investigate further. A few splits immediately jumped to mind – apart from party affiliation, I expected opinion to differ by age and gender, but perhaps the most interesting factor to consider would be religion: many religious people cite their faith as their moral compass, and the question of whether a state should execute its citizens is fundamentally a moral one.
How would opinions vary across these factors, and which would be most important in determining a person's outlook?
For these investigations I would need lots of data. The survey above sampled opinions from 2,188 adults, big enough to examine attitudes by party or age-group, but not to drill down into two splits at once, or to examine categories such as religion that weren't published in its data tables.
Luckily, YouGov asks a question on this topic as part of the British Election Study (BES), a large scale longitudinal survey that has been running since 2014. This survey collects a wide range of demographic data, including religious affiliation, and crucially has very large sample sizes, typically sampling over 30,000 adults for each of its waves.
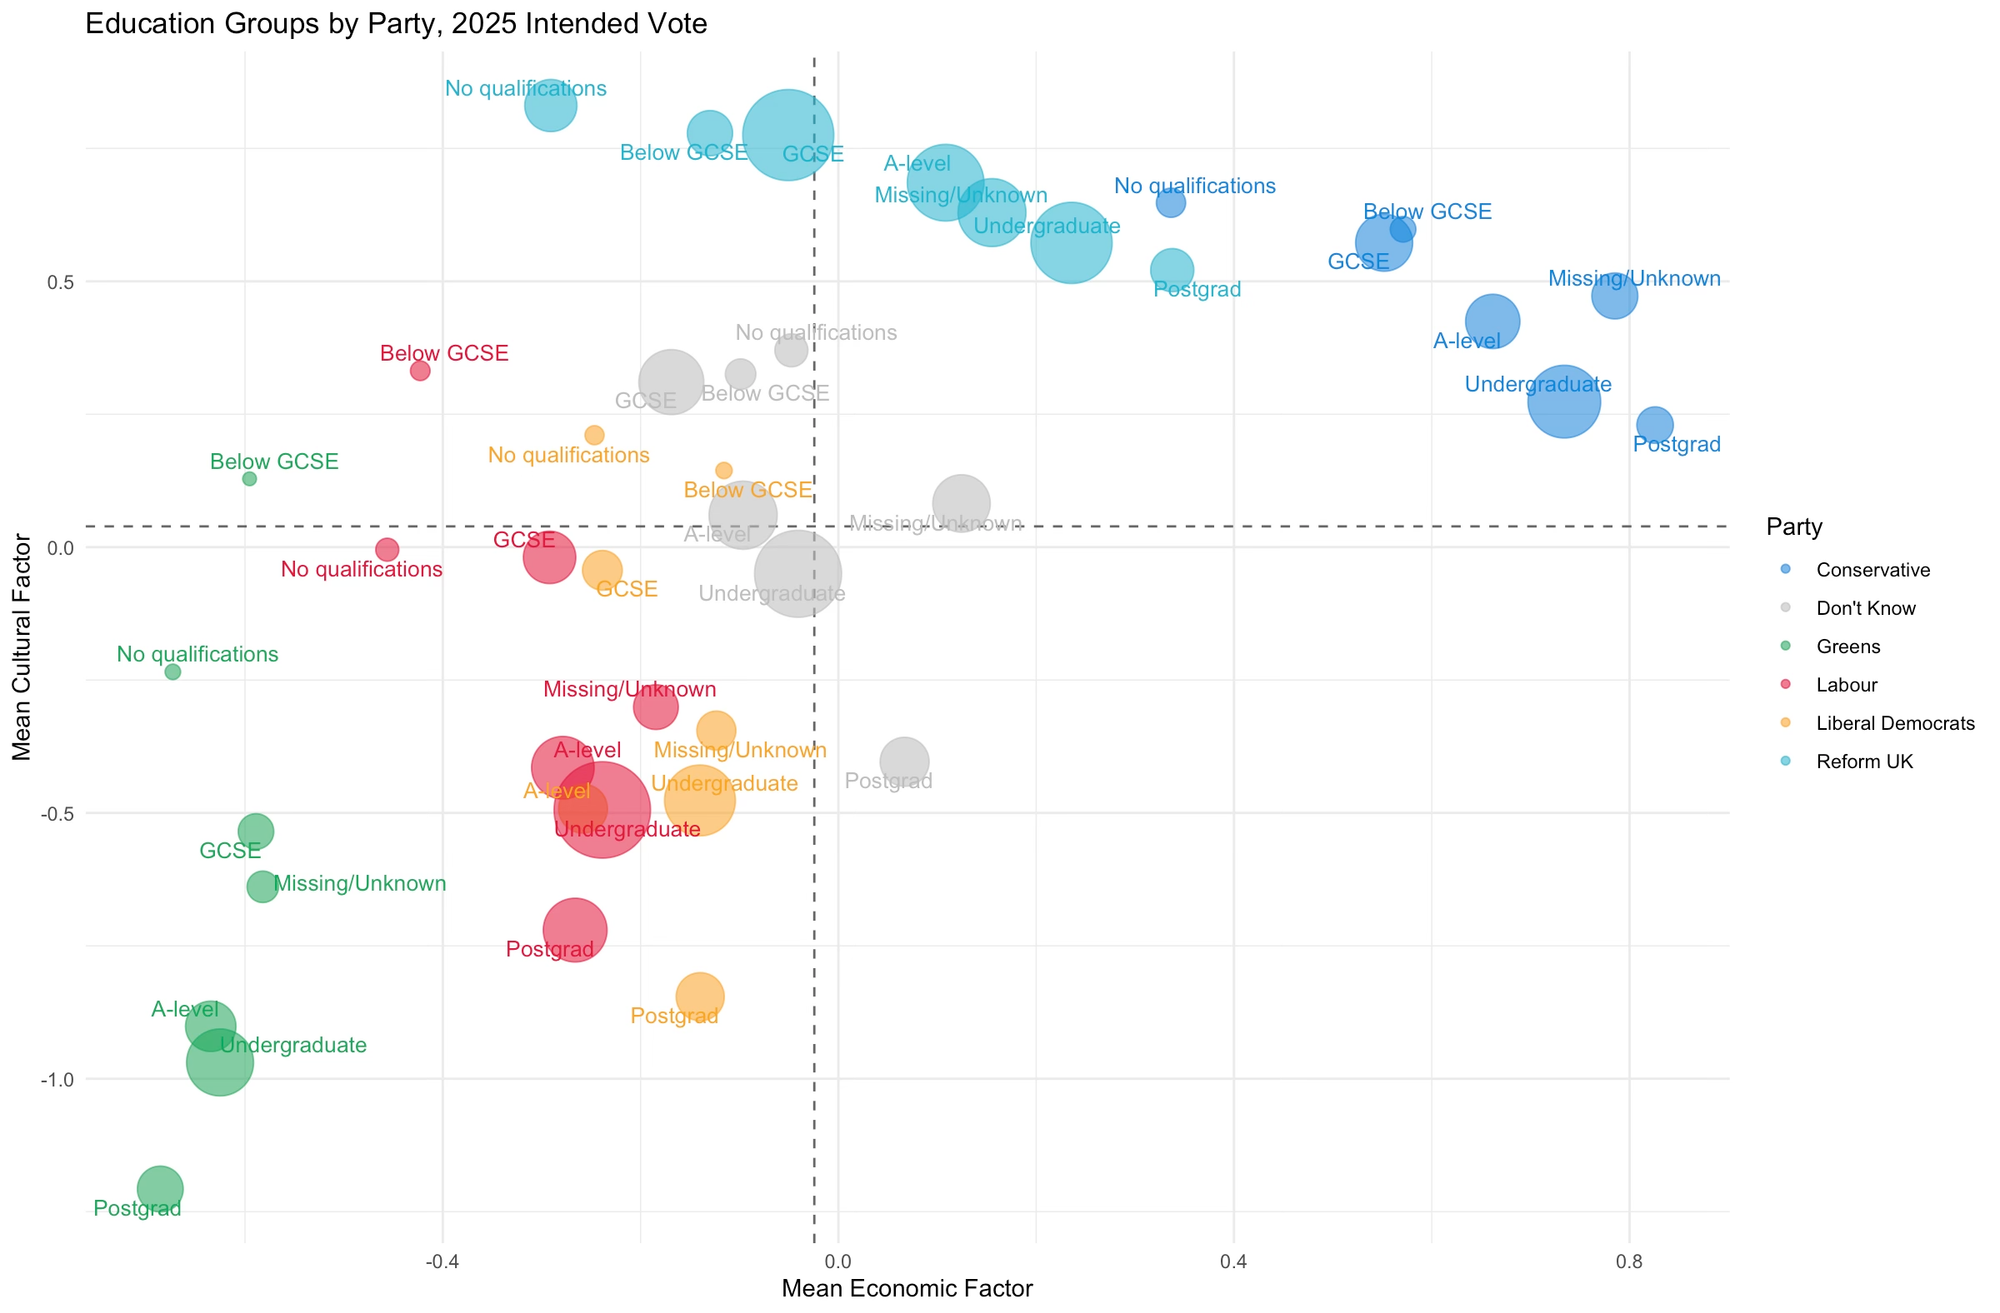
There is already some excellent analysis of the BES data. For example, over a series of posts on his blog, Ben Ansell eviscerated the Blue Labour strategy of chasing Reform voters, using “bubble plots” as his weapon of choice. These plots group respondents by party voting intention and one other attribute, orienting the groups along two axes, corresponding to their mean social and economic attitudes.
An example grouping voters by party and education level is shown below – click on this chart to read Ansell's discussion of the distinct left- and right-bloc electoral dynamics it suggests.
A second moral question – wealth redistribution
The questions used by Ansell's analysis to score voters along the socio-cultural axis include one on support for the death penalty. And those used for the economic axis include another fundamentally moral question – whether governments should redistribute income from the better off to those who are less well off.
As with matters of life and death, many religions have something to say about wealth and poverty. I decided to add this question to my analysis and, inspired by Ansell's bubble plots, to use a similar two-axis approach to plot their adherents' attitudes to these two moral questions.
How do attitudes vary by politics?
Before we get to religion, let's look at how attitudes differ by political party. In the following plots, we will use the horizontal axis to display net support amongst each group for the death penalty, with increasing support as we go from left to right, and the vertical axis to indicate support for wealth redistribution, increasing from bottom to top.
Average levels of net support for these policies across voters for the main British parties (Northern Ireland isn't included in the BES data) are plotted below:
This chart demonstrates why “left bloc” voters might be surprised to learn that the majority of Brits support the death penalty. Within the Labour, Green and Liberal Democrat voter bases, as well as amongst SNP and Plaid Cymru voters, there is clear net opposition. If you mainly associate with these groups, you could easily assume that their attitudes are representative of the country as a whole.
However, the strength of support (+69%) for capital punishment amongst Reform voters, alongside more moderate net support from Conservatives (+27%), ensures that there is actually overall net support for the death penalty nationwide.
Attitudes towards wealth distribution are less surprising, with left bloc voters all displaying net support, whilst on the right, big-C Conservatives are the most small-c conservative, with net opposition of -40%.
Mean opinions by age and gender
Attitudes by age group and gender display a clear pattern too. On average, the older respondents are, the more support for the death penalty and opposition to wealth redistribution they display. And whilst economic attitudes are broadly similar for male and female respondents of the same age, men are significantly more likely to support the death penalty at all ages, with this difference particularly wide amongst the youngest and oldest groups:
Whilst I would like to understand why older men are so much more comfortable with state-sanctioned execution than younger women, what really interested me was to see how religion would affect attitudes.
Attitudes by religion
YouGov captures religious affiliation at a granular level, with several Christian denominations broken out in addition to the other most common religions. The average attitudes for each religious group from the most recent wave of the BES are plotted below:
There are a few observations to make here. Firstly, the bubble sizes, which reflect the number of respondents identifying with each religion, do not reflect their proportions in the population as recorded in the census – smaller religions are under-represented.
This is a known issue amongst pollsters. Minority ethnic and religious groups have lower participation rates in surveys, and there is evidence of this fact here. However, assuming that those respondents are representative of their coreligionists, this is not a problem. We are examining net support per group, not the relative sizes of the groups themselves, and the subsample sizes are still big enough to measure these statistics robustly.
Thou shalt not kill?
The second, more surprising observation relates to the two largest bubbles. In the bottom-right corner of the plot, it is striking that Anglicans, the largest religious group in Britain, are amongst the strongest supporters of the death penalty (with net support of +32%), and have the strongest opposition to wealth redistribution of all groups (-13%).
This contrasts with the largest group of all, non-religious Britons, representing just over half of BES respondents. This group is more equivocal on the death penalty (while still displaying marginal net support of +8%), but much more clearly in favour of the redistribution of wealth (+22%).
Thirdly, it is notable that Anglican attitudes are not representative of Christians in general. In particular, levels of support for the death penalty amongst British Christians vary widely by denomination: whilst Anglicans, Presbyterians and Orthodox Christians show the strongest net support for capital punishment; Catholics, Pentecostal Christians and Methodists are more equivocal (although still showing stronger support for it than the non-religious); and Baptists, Evangelicals and members of the United Reformed Church all display net opposition.
There is much less divergence on attitudes to wealth redistribution between denominations. Anglicans are the most strongly opposed, but most Christian denominations are fairly equivocal, indicating a balance between those for and against redistribution (or on the fence) within their congregations.
Is this just driven by age?
Anglicans are an older bunch than the non-religious. How much of the attitudinal difference discussed above does this explain? The answer is some, but not all, as the following plot demonstrates. Here I have aggregated Christian denominations to reduce clutter – this does not change the overall conclusion:
Both Christians and the non-religious become more supportive of the death penalty, and more opposed to wealth redistribution, with age. However at each age category, there remains a clear difference between these two groups. The picture for other religions is less clear.
Which matters more, religion or politics?
Keen observers may have noticed that the bubble charts plotted so far all use slightly different scales on their respective axes. This enables variance across the levels of each of these categories to be examined at an appropriate level of zoom, but hides the fact that the variance is much greater across some categories than others.
I was fascinated to know which would be more important in determining moral attitudes, religion or politics? The chart below plots both of these splits (with religious groups now aggregated at a higher level) on the same scale:
Here we can see that that, in the absence of any other information, political allegiance is a stronger guide to these moral values than religion: while Anglicans as a group are more in favour of capital punishment and more opposed to wealth redistribution than the other religious groups, they are still to the left of an average Reform voter when it comes to the death penalty, and more in favour of wealth redistribution than the average Tory (although it is notable in this comparison that they still have greater support for capital punishment).
To drill down further into the interplay of these two factors in determining attitudes, we can plot their combination. Here I have further aggregated all Christian denominations to reduce chart clutter:
This plot confirms that politics trumps religion when it comes to the attitudes we are examining: within party support bases, there is much greater homogeneity of attitudes across different religious groups than there is within each religious group across different party affiliations.
The uniformity of attitudes across religion for the two main right-wing parties is particularly striking. If you know that someone is a Reform UK or Conservative voter, then their religion (or lack of it) shouldn't make much difference to your expectation of their moral attitudes.
This contrasts with the parties of the left – these parties' religious voters are significantly more hawkish regarding the death penalty than their respective non-religious political brethren. On the economic axis, Christian voters on the left are slightly but consistently less supportive of redistribution than non-religious voters, whilst there is a mixed picture for adherents of other religions.
Christian nationalism in the UK?
What can we learn from all of this? Personally, my main reflection is another reality check: the discovery that as a group, Anglicans hold more hardline views than those suggested by the twee “tea-party at the vicarage” stereotype I had previously held in my head.
This led me to revisit one of my previous articles, in which I examined religious identification trends in the UK in the context of an increasingly assertive Christian nationalism growing in (and potentially being imported from) the US.
In this article I noted that:
Two of Reform UK’s key thinkers – Cambridge academic James Orr and Tory defector Danny Kruger MP – are leading the cross-atlantic transposition of this ideology, with a stated belief that “Christianity ought to serve as the foundation of a new national order.”
The article concluded that, despite these efforts, the demographic conditions required for this transposition to succeed were disappearing rapidly in the UK, if they ever existed at all.
However, while overall religious demographics may not be in favour, the evidence here indicates that on some measures at least, social attitudes amongst a large constituency of religious Britons may be more similar to those in the US than I had thought.
Could an Anglican constituency that supports the death penalty as emphatically as it appears to, also support other policies that I had, until now, naïvely taken to be beyond the pale? It is clear that James Orr, the man who until this Friday was Reform UK's head of policy, believes so.
As the Financial Times reported in a profile of him published on the previous day:
His religious sensibilities, such as the idea that married parents should be given priority access to social housing, are firmly imprinted in Reform’s policies: a blueprint for a new British right. He champions traditional gender roles, opposes abortion including in cases of rape, regards Russia’s invasion of Ukraine as a “regional Slavic conflict” and calls immigration the “most existential threat facing our nation since the Norman invasion”.
Events have since done what they do best – James Orr was in place when I started this article, but no longer holds this role. Hours after the FT article was published, Channel 4 published an exposé of alleged funding activities at Reform UK, with Orr a central character in the plot. Following that, early on Friday he stood down from his role at Reform UK, pending an internal investigation, although as I write, he is still in place as an associate professor at Cambridge University, teaching ethics at one of England's most prestigious institutions, despite how unethical his own behaviour seems to have been.
Is the Anglican church out of touch with its own flock?
James Orr is not alone in marrying political influence to an explicitly religious social agenda. Others such as Danny Kruger within Reform UK share similar views, and a growing number of wealthy and influential individuals including Paul Marshall, owner of the Spectator and co-owner of GB News, have made clear their desire for an assertively Christian society.
But does their moral agenda match the official stance of the institution they claim allegiance to – the Church of England itself?
The official stance of the Anglican church is that it opposes capital punishment. Although Article 37 of its Thirty-Nine Articles states that “The Laws of the Realm may punish Christian men with death, for heinous and grievous offences”, the Lambeth Conference of Anglican and Episcopalian bishops was explicit in condemning the death penalty in 1988, a position it has not altered since:
This Conference: ... 3. Urges the Church to speak out against: ... (b) all governments who practise capital punishment, and encourages them to find alternative ways of sentencing offenders so that the divine dignity of every human being is respected and yet justice is pursued;
On the subject of wealth redistribution, recent proof of its stance came in November 2021, when the General Synod passed a motion specifically concerning wealth inequality, calling on the government (and all political parties) to:
"adopt an explicit policy of reducing the wealth gap between the rich and the poor and the disadvantages that flow from it."
In summary, the Church of England is opposed to the death penalty and clearly in favour of reducing the wealth gap between rich and poor. But these stances do not appear to be reflected in the average attitudes of those who identify as Anglican.
Questioning perceived majority and morality
This investigation started with my surprise that so many people in Great Britain supported the death penalty. It led me to a further surprising revelation that, on average, Anglicans are amongst those most in favour of this penalty, whilst simultaneously displaying the greatest opposition to redistributing wealth.
This appears to be the constituency which Orr, Kruger and Marshall, amongst others, are appealing to with their US-inflected brand of conservative Christian nationalism. I remain sceptical that they will succeed.
However, while the official stance of the Church of England is one of compassion, the Anglican moral compass, as evidenced by the attitudes of its flock, appears to be pointing quite significantly to the right of where I had assumed it would be.
All the code and data behind this article are available on github. If you have any questions, please leave a comment or get in touch at jack@believethedata.org.
Finally, if you've enjoyed reading, please consider subscribing below, or following the blog for updates on Bluesky.